Read charts and results
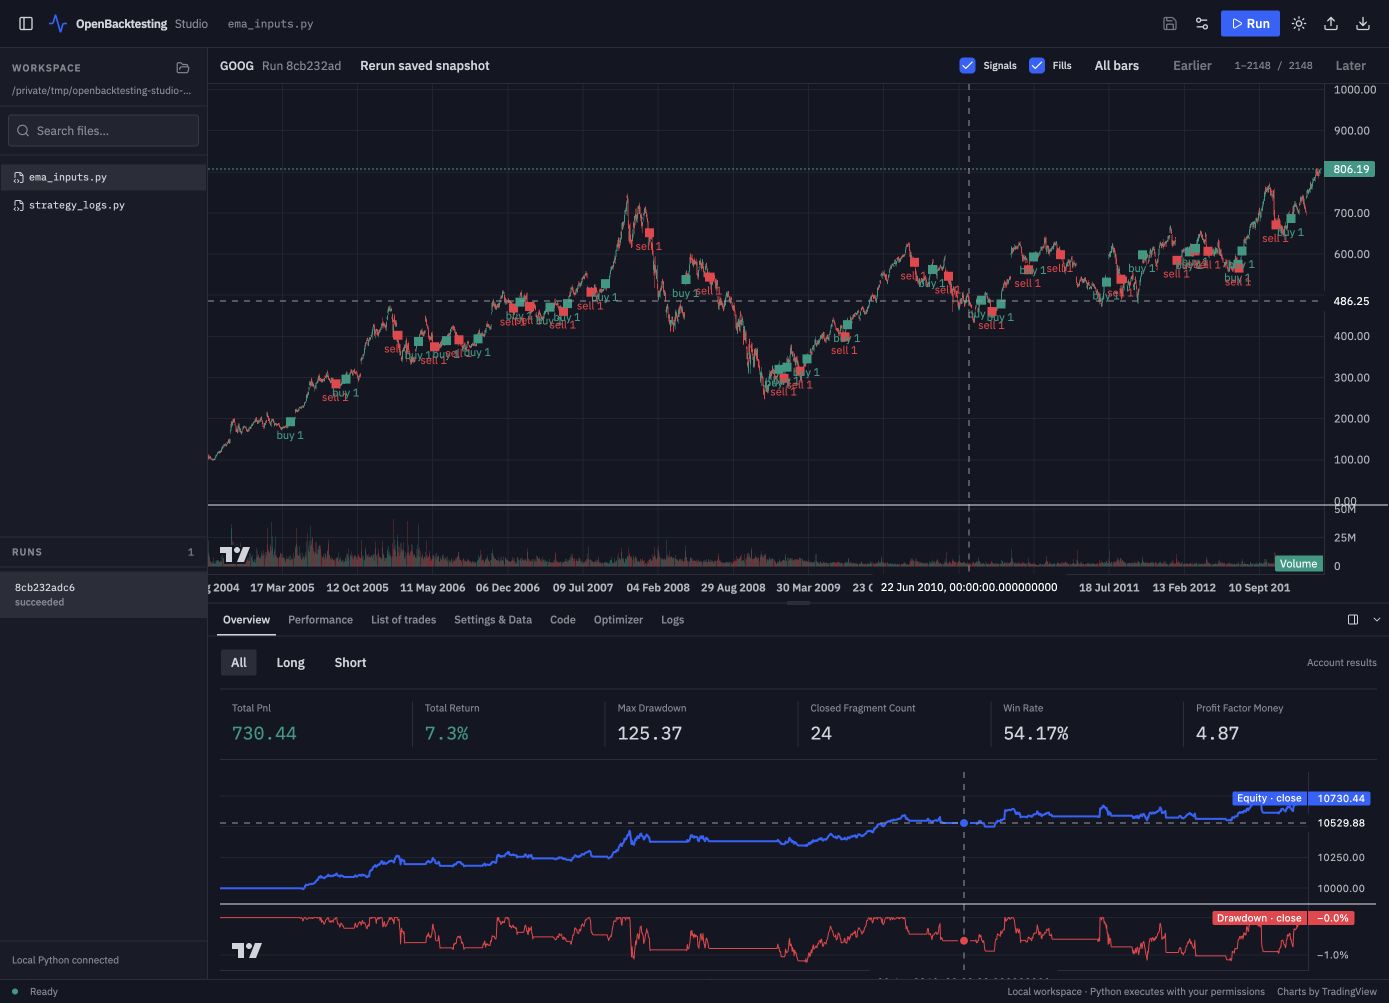
The chart shows the selected run's saved data. Signals and Fills control separate layers; All bars, Earlier, and Later change the displayed window. Indicator declarations determine which series appear on the main chart or secondary panes. Click a trade's location action to inspect its original execution.
| Tab | What to inspect |
|---|---|
| Overview | Headline metrics and the equity curve |
| Performance | Detailed metrics and All / Long / Short contributions |
| List of trades | Trades and execution tables, record details, and chart locations |
| Settings & Data | The configuration and data identity saved for this run |
| Code | The selected workspace file or an explicitly opened source snapshot |
| Optimizer | Saved parameter experiments and their trial reports |
| Logs | Strategy messages, worker output, and errors |
Use the panel icon beside the tabs to move results below the chart or to its right. Drag the divider to resize; focus it and use arrow keys for keyboard resizing. Placement and size are remembered. Collapsing the panel does not discard its state.
Select a completed entry under Runs to reopen its saved report and chart without executing the strategy again. Rerun saved snapshot explicitly creates a new run from captured source and data when those resources are available. Out of date means the displayed run differs from the current source or configuration; it does not invalidate the saved result.